New: Performance Review V2
We've launched an all-new version
20 March, 2026
Structured framework
Built from the ground up for structured data perfect for insights and reporting, so review data becomes queryable, comparable and useful.
Customer-driven platform
Easier to iterate on customer requests; feedback turns into real product improvements faster.
Future-proofed architecture
A platform designed to unlock entirely new capabilities without painful migrations.
Scalable
Handles large orgs and complex review programs reliably and predictably.
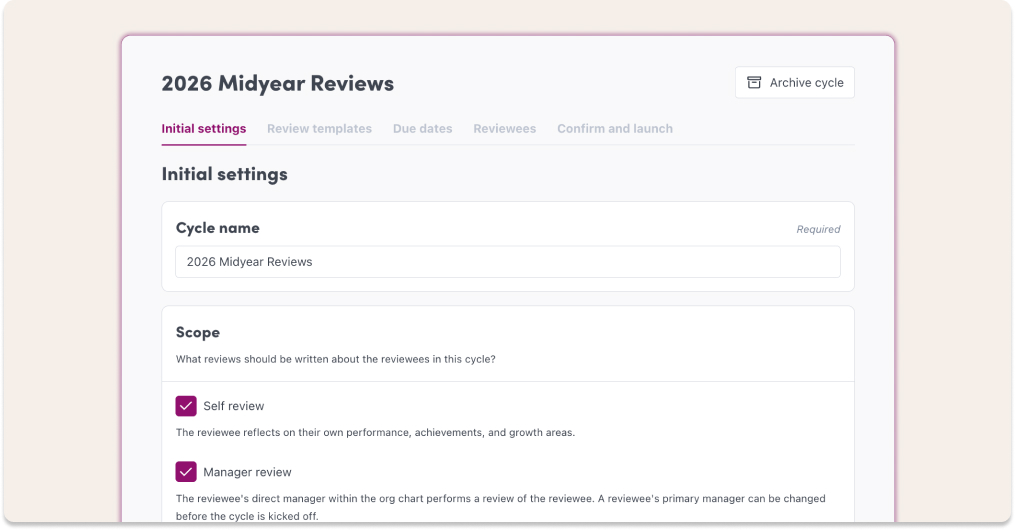
New Cycle Configuration
Scopes — Define who’s in scope for a cycle; self review and / or manager
Due dates — Enforced deadlines and sensible reminders.
Pick participants at scale — Select hundreds of employees in one go.
Deploy in bulk — Launch review cycles across teams/orgs with one action.
Packet sharing — Share pre-built review packets to speed rollouts.
Templates
Reorder questions — Drag-and-drop to craft the flow you want.
Required / optional — Make fields mandatory or optional to match your process.
New notifications
Due-date reminders — Smart nudges so reviewers actually complete their reviews.
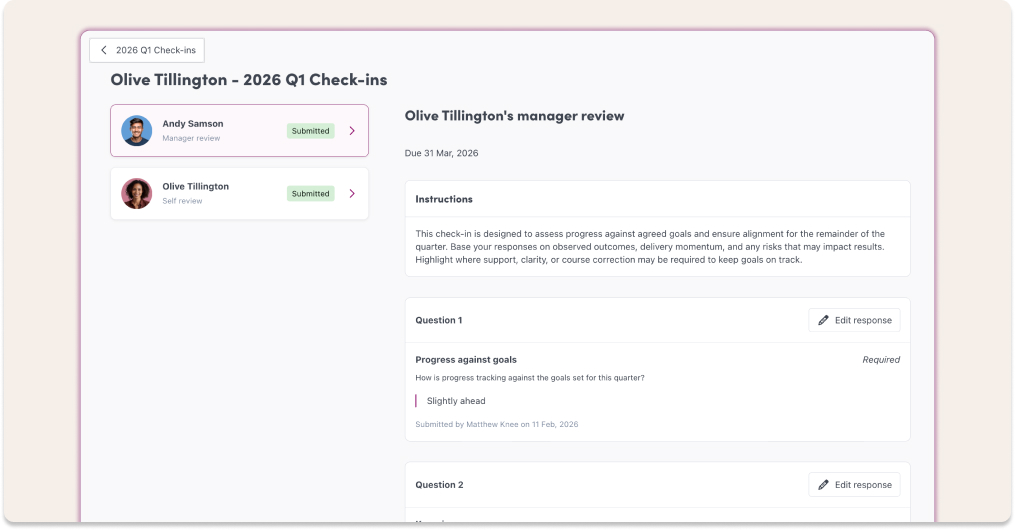
Accessibility
Quick toggle between reviews — Flip between an employee’s reviews in one click for fast context and calibration.
Insights
Cross-cycle analytics, trends and meaningful signals.
Cycle Progress
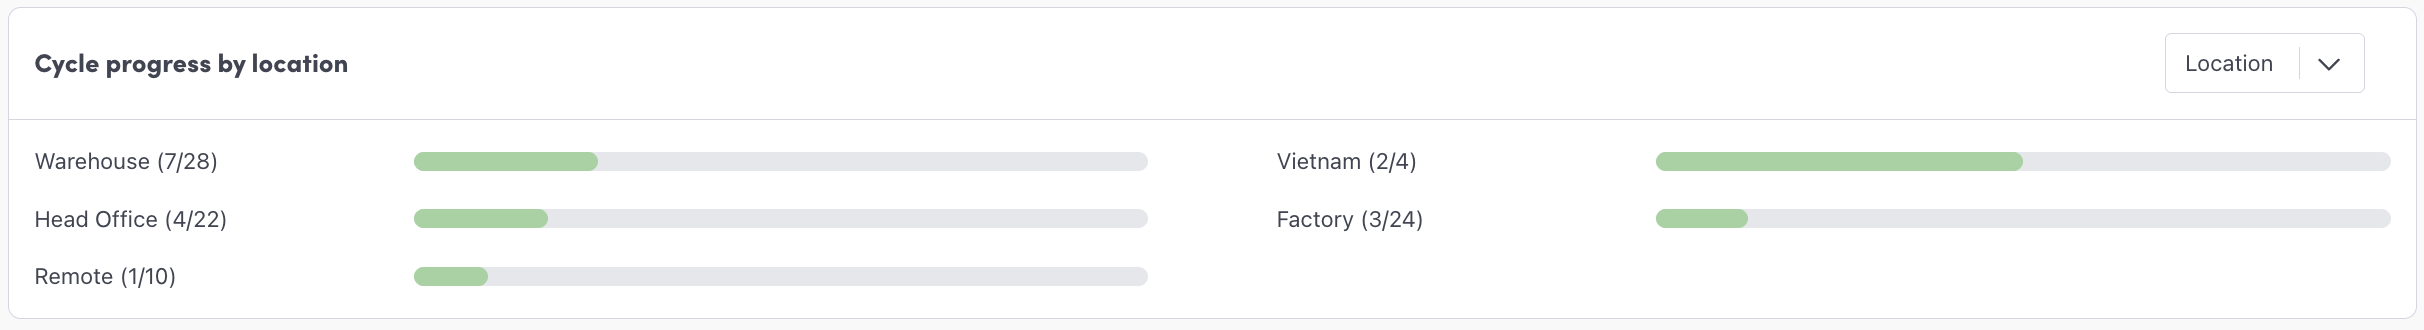
This helps you quickly identify:
Who has completed their reviews
Where follow-up may be required
9 Box Talent Matrix
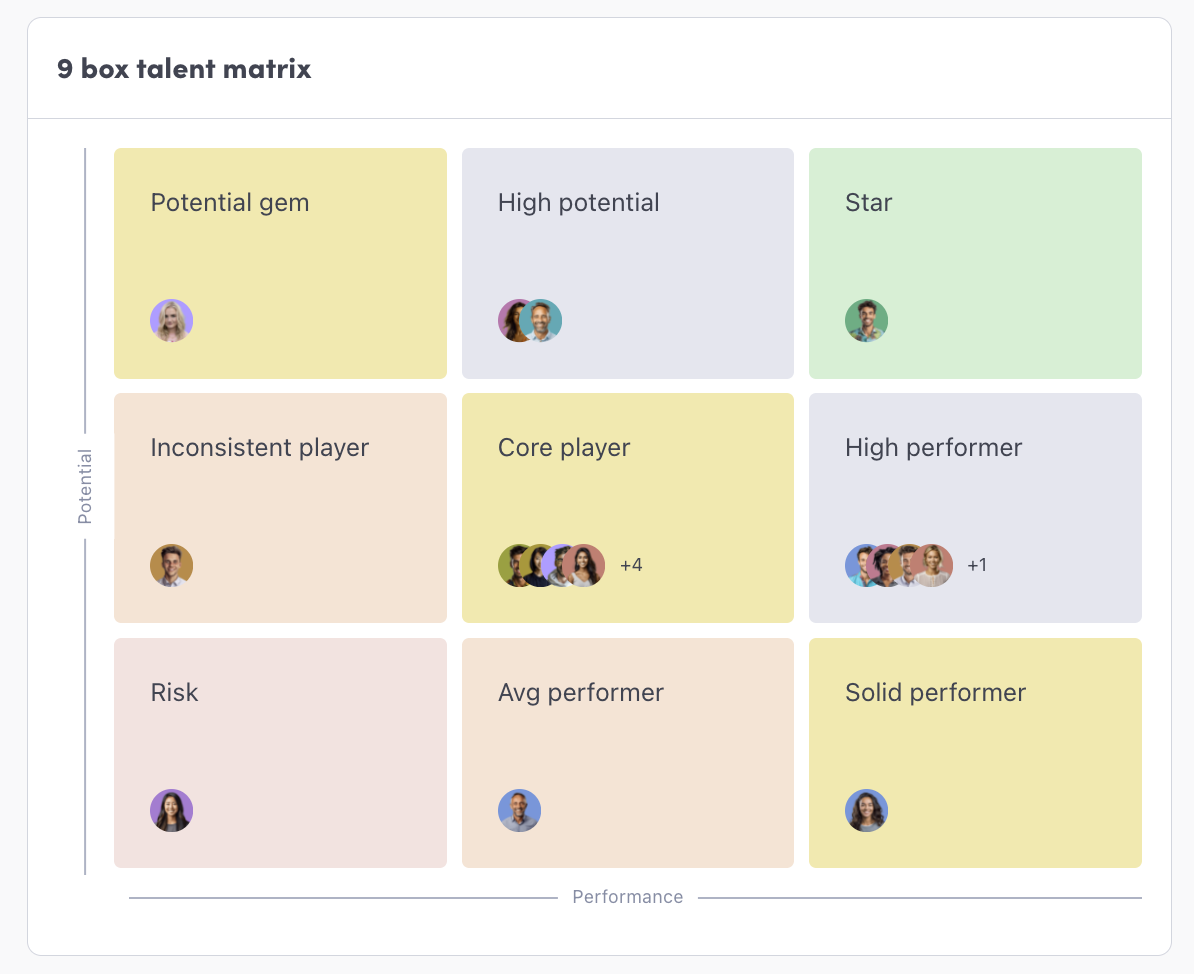
The 9 Box Matrix visualises employee performance against potential.
The matrix then categorises employees into segments such as:
High potential
Solid performer
Risk
Star
This helps with talent planning and succession decisions.
Performance Overview
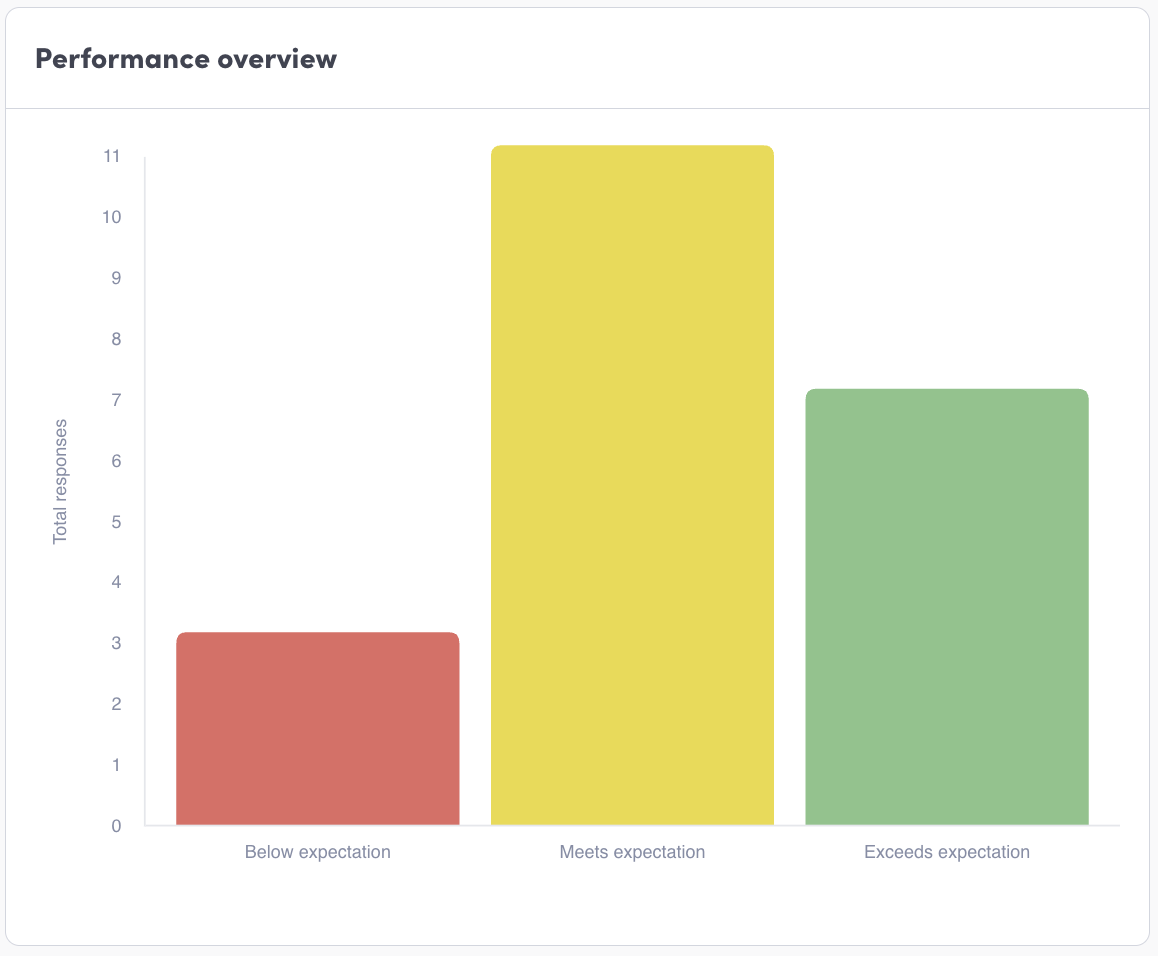
The Performance Overview chart shows the distribution of performance ratings across your organisation.
Responses Heatmap
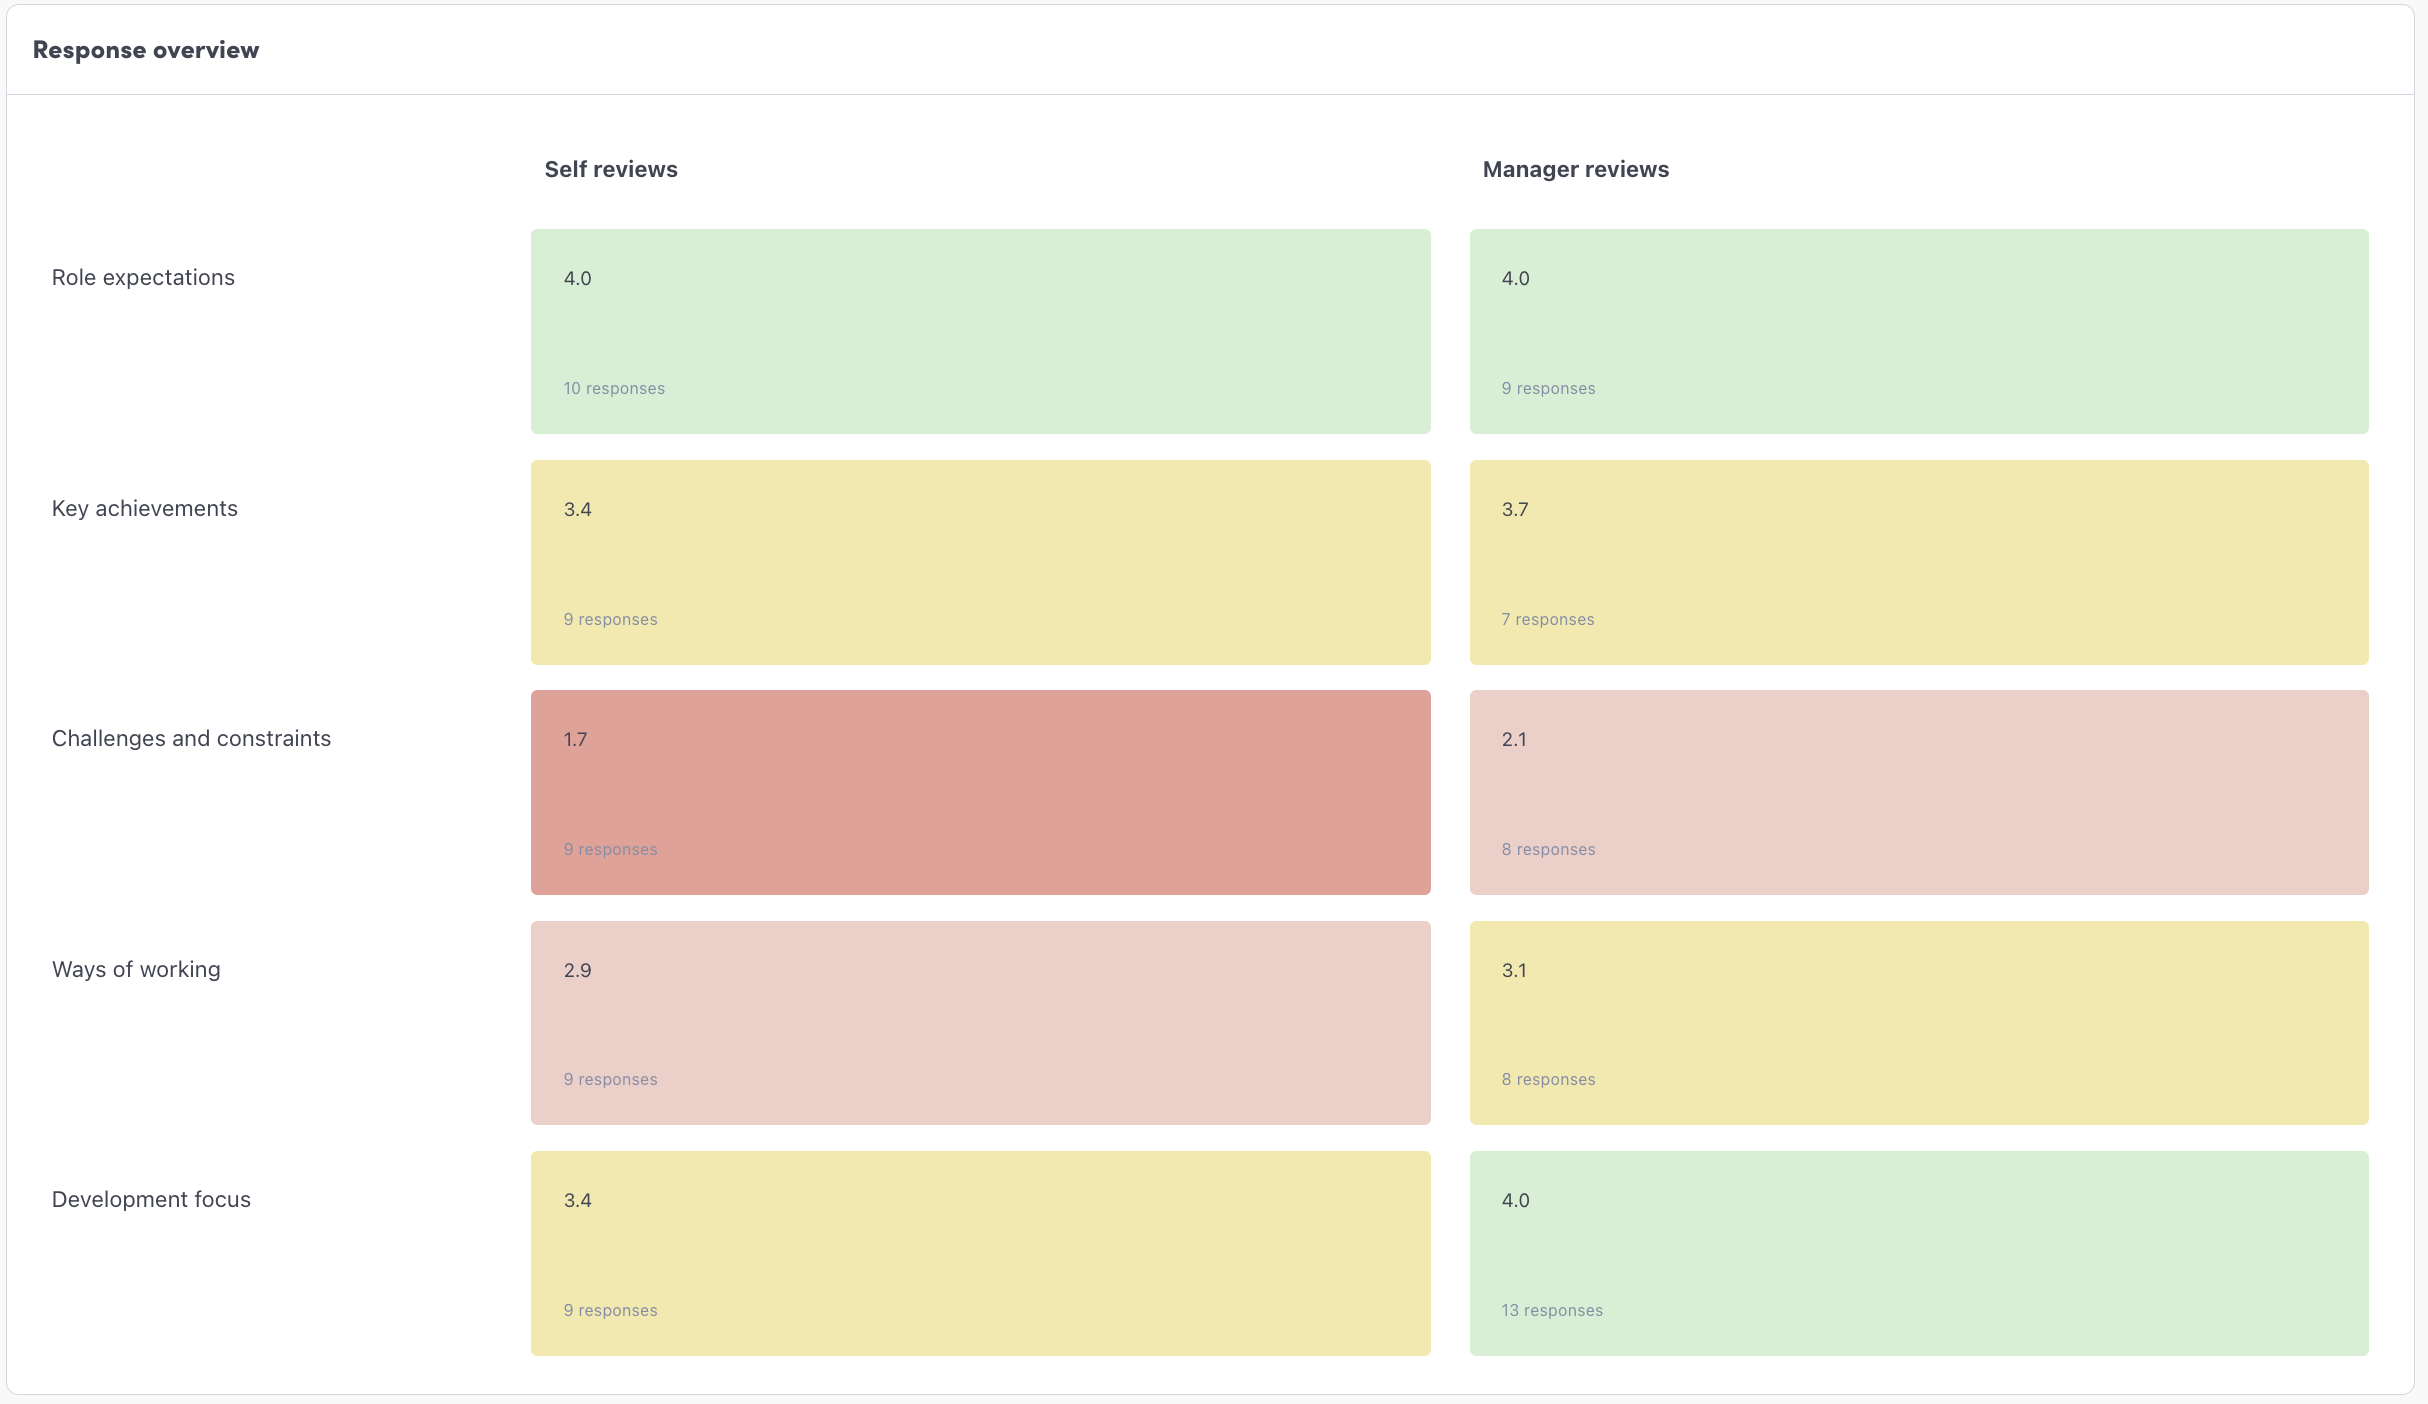
The Responses Heatmap shows aggregated responses across review questions.
Works with any Likert scale question
Displays average scores and response counts
Compares Self vs Manager responses
This helps you:
Identify trends in feedback
Spot alignment (or gaps) between employees and managers
Highlight areas needing attention